Michelson Interferometer
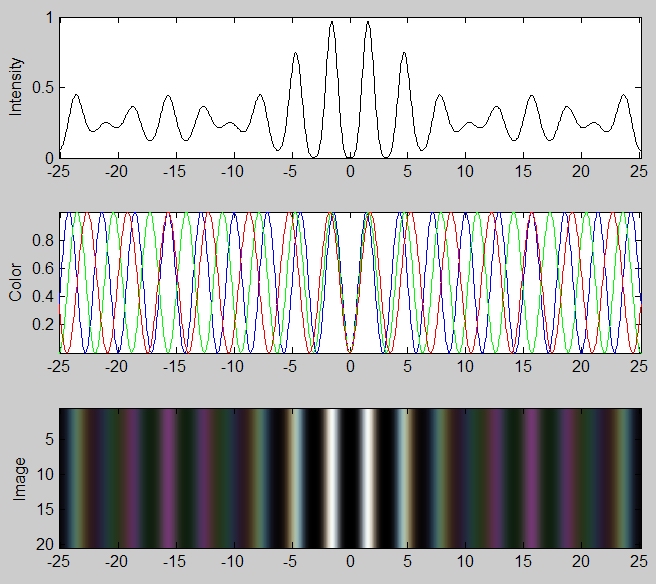
This was a simulation I did in Matlab illustrating how white light fringes form using red, green, and blue light. Notice how the phase changes for three different wavelengths of light as the path difference in the two beams changes. The middle plot is the intensity of the fringes determined from the square of the sum of the plot of the three different colors. The top image was formed by adding the sum of the individual colors and then modulating this sum by the intensity pattern. I like how this simulation shows the uniquely colored pink and green fringes seen in the picture of the white light fringes below.
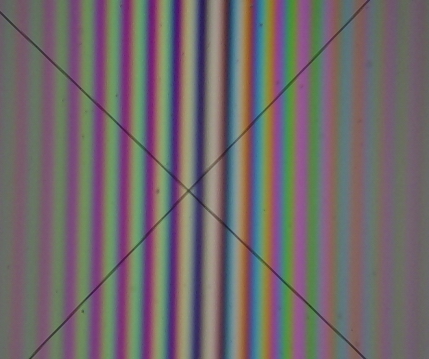
Here is a picture of white light fringes. A 1/8-wave non-polarizing cubic beam splitter was used in the Michelson Interferometer.
.
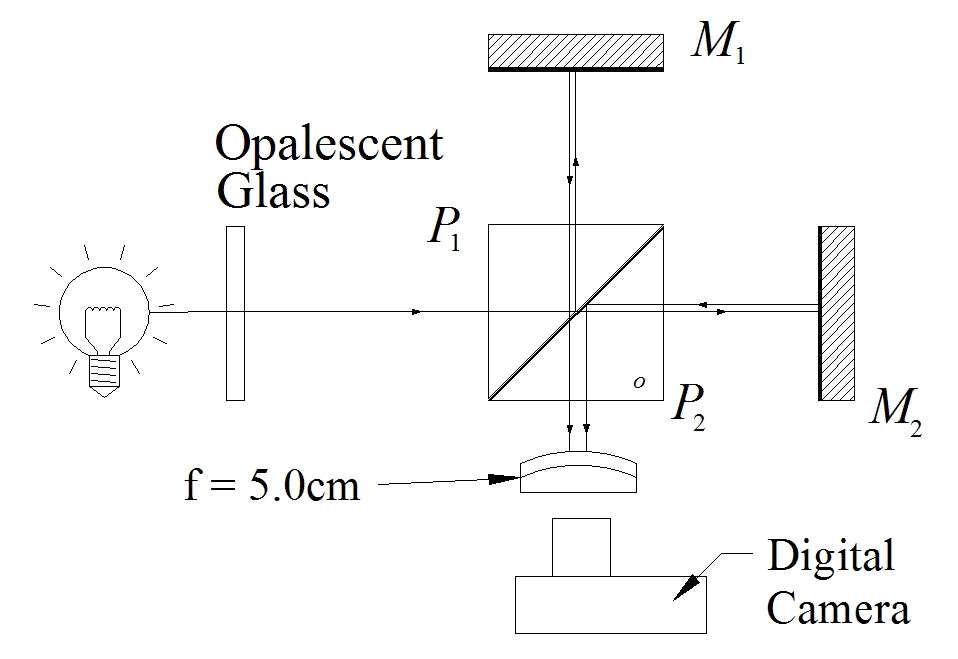
Below is a diagram of the setup used to make the picture of the white light fringes.