|
Math 205 |
Graphs for Problem 19 in Section 3.3 p204 (three different viewpoints). These graphs were created using Graphing Calculator (under the Apple Menu on a Mac). Try to see how z = f(x,y) has a minimum value of zero at (0,0) if (x,y) is restricted to lie on a straight line (any straight line) through (0,0), yet in every neighborhood of (0,0) there are points where f(x,y) < 0, so that f does not have a relative minimum at (0,0). It's easier to see that f does not have a relative minimum at (0,0) than it is to see what happens when (x,y) is restricted to lie on a straight line through (0,0), but have a look. Better yet, use Graphing Calculator yourself to look at the sketch from various viewpoints.
![]()


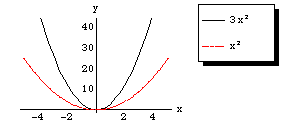
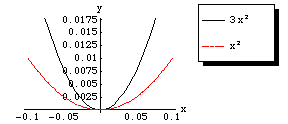
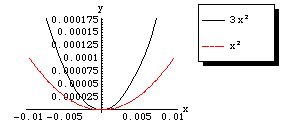
Graphs for Problem 19, from Section 3.3 p 204, showing the region where f(x,y) is negative. Here's are some graphs showing y = 3x2 and y = x2 on the same set of axes. In the region between the two parabolas, the function z = f(x,y) = (y-3x2)(y-x2) will take negative values. On either of the parabolas, f(x,y) will be zero, and at the remaining points (either inside both parabolas or below both parabolas) f(x,y) will be positive. Notice that straight lines through the origin, when restricted to a small enough neighborhood of the origin, will avoid that region between the two parabolas where f(x,y) < 0. (This is because both parabolas are flat at the origin, while straight lines will have some nonzero slope there. The parabolas eventually sneak below any particular line through the origin.) These graphs were created using Joy of Mathematica and Mathematica.

Zoom in closer:

Zoom in yet closer:

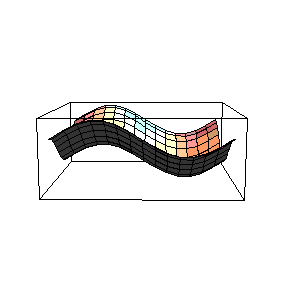
Graph for Problem 33 in Section 3.3 p204.
Shown below is a graph for problem 33, presented using a viewpoint that makes it fairly easy to see that the absolute minimum occurs at an interior point of the rectangle, while the absolute maximum occurs at two opposite points of the boundary. This graph was created using Mathematica and Joy of Mathematica. The function is z = f(x,y) = sin x + cos y.

Graph for Problem 1a, Section 5.1, p300. This graph shows z = x4y+y2 for y between 0 and 1 and x between -1 and 1. For these values of x and y, the z values are positive. The integral represents the volume under the surface z = x4y+y2 and above the specified rectangle. This graph was created using Mathematica with Joy of Mathematica.
.gif)