| |
The spectroscopy underlying the coupled-channel Schrödinger equation (CSE) model of the N2 photoabsorption spectrum is discussed in detail in Lewis et al. (2005, 2008), Haverd et al. (2005), and related publications. A reference list of these publications and a bibliography of the experimental and calculational database informing the CSE model are available elsewhere on this website. The computed N2 photoabsorption spectrum replicates the experimental database, to within the stated experimental uncertainties, for the isotopologues 14N2, 14N15N, and 15N2. Detailed comparisons of the model’s predictions with measured values of line positions, line strengths, and line widths can be found in the above references.
Brief summaries of the relevant spectroscopy and of the CSE model are presented below. A summary of the characteristics of the N2 photoabsorption spectrum in the 100,000 to 105,000
cm-1 region follows.
The electric-dipole-allowed absorption spectrum of N2 shortward of 100 nm arises from transitions to the strongly perturbed vibrational progressions of three Rydberg and two valence states. c'4 1Σu+ and c3 1Πu are the lowest members (n = 3) of the npσu and npπu Rydberg series converging to the X 2Σg+ ground state of N2+; the o3 1Πu state is the n = 3 lowest member of the nsσg series converging to A 2Πu of N2+; and b 1Πu and b 1Σu+ are valence states. Stahel et al. (1983) first reproduced the anomalous absorption strength patterns observed within the vibrational progressions by treating the homogeneous Rydberg-Rydberg and Rydberg-valence interactions among the five electronic states. Interactions between the 1Π and 1Σ manifolds were not incorporated in the model. Spelsberg & Meyer (2001) refined the analysis of Stahel et al. by combining ab initio potential curves with R-dependent electronic coupling parameters and transition moments optimized to reproduce laboratory measurements.
Lewis et al.(2005) developed a quantitative model for the b, c3, and o3 1Πu states that clarifies the predissociation mechanisms affecting the photoabsorption spectrum. Their CSE model of the b, c3, and o3 interactions with the C and C' 3Πu states showed that the spin-orbit interaction between the b 1Πu and C 3Πu levels, along with an electrostatic interaction between the C state and the continuum of C' 3Πu, accounts for the observed line-broadening patterns. In an extension of the 1Πu and 3Πu CSE model, the measured rotational effects in line strengths and predissociation line widths in the X(0) → 1Πu vibrational bands were modeled by Haverd et al. (2005). A further extension of the CSE model by Lewis et al. (2008), which includes the 3sσgF3 3Πu and 3pπuG3 3Πu Rydberg states, identified a strong Rydberg-Rydberg interaction between the F and G states, and enabled the extension of the 1Πu predissociation model to higher transition energies. The computed photoabsorption spectra presented in this website are calculated from a version of the CSE model that incorporates heterogeneous interactions of the 1,3Πu manifold with the c'4 1Σu+ and b' 1Σu+ states. The details of this expanded model have not yet been published. The expanded CSE model was recently used to calculate nitrogen isotopic fractionation in the atmosphere of Titan (Liang et al. (2007), as well as to elucidate the radiative properties of the c'4 1Σu+ ← X 1Σg+ band system (Liu et al. (2008), Khakoo et al. (2008), Liu et al. (2009)).
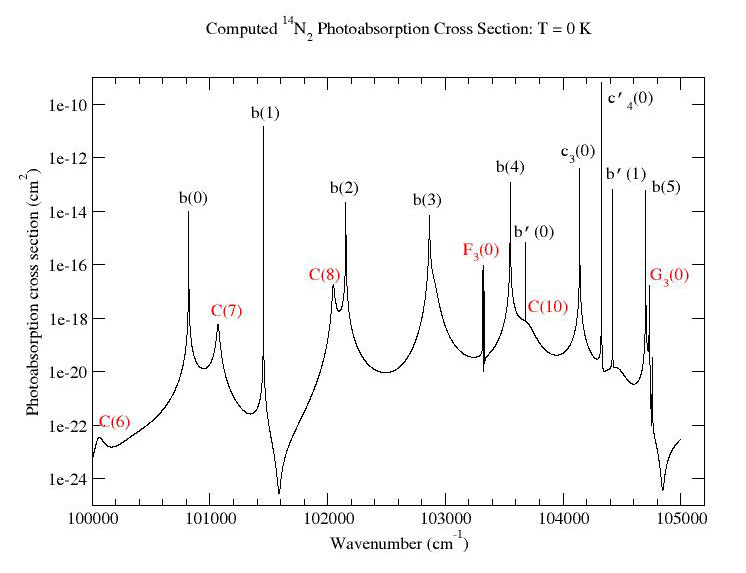
The 100,000 to 105,000 cm-1 region of the photoabsorption spectrum is dominated by the lowest-v members of the X(0) → b(v) 1Πu vibrational progression along with the strong X(0) → c3(0) 1Πu and X(0) → c'4(0) 1Σu+ bands. The weak X(0) → b'(0,1) 1Σu+ bands complete the dipole-allowed transitions in this region. A number of very weak and broad transitions to the C(v) 3Πu levels are present, along with the very weak, but sharp, X(0) → F3(0) 3Πu and X(0) → G3(0) 3Πu bands. Detailed spectroscopic evidence for the transitions to the triplet levels is presented in Lewis et al. (2008b).
Band identifications are indicated in the figure below, which displays the computed 14N2 spectrum at T = 0 K.

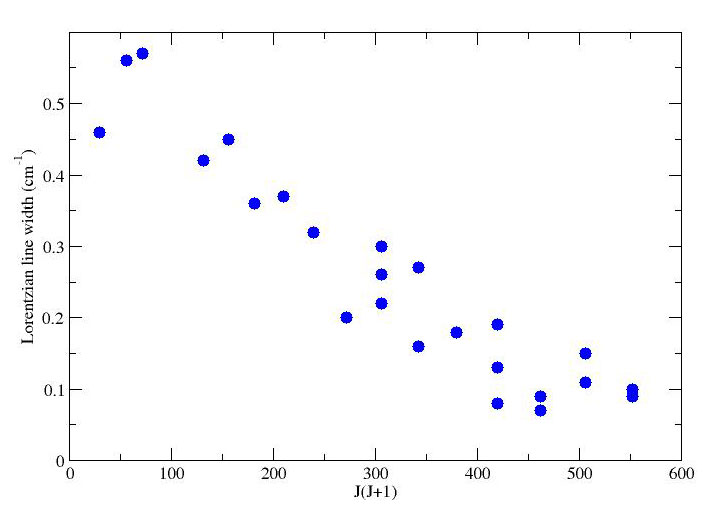
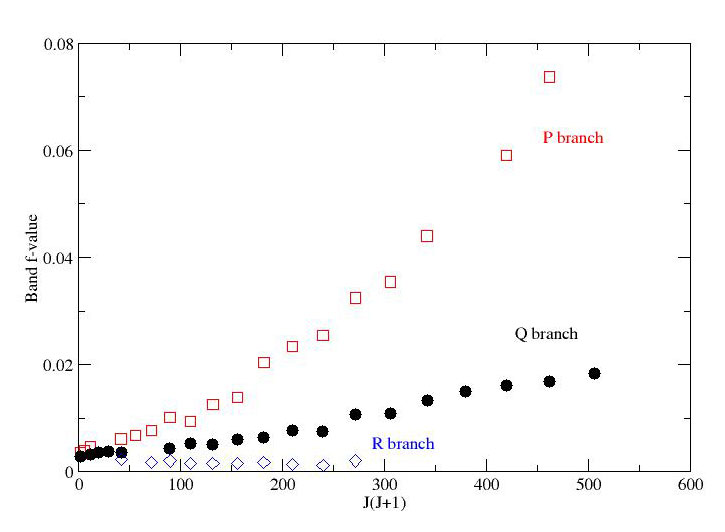
The strong Rydberg-Rydberg, Rydberg-valence, and valence-valence interactions among the singlet and triplet states of N2 produce striking rotation-dependent effects on line strengths and widths. Evidence for these effects is presented in Stark et al. (2005, 2008), Heays et al. (2009), and Haverd et al. (2005). Extreme departures from standard line intensity patterns (i.e., those associated with Hönl-London factors) and strong J-dependences in line widths may significantly affect radiative transfer models. The CSE model spectrum reproduces the observed line strength and line width patterns in the all of the isotopologues of N2. Examples of measured rotation-dependent line-strength and line-width patterns in the 100,000 to 105,000 cm-1 region are shown below.

Experimentally determined Lorentzian components of line widths (FWHM) in the b(2) – X(0) band.

b(5) – X(0) band f-values determined from rotational line f-values and Hönl-London factors (P branch – open squares; Q branch – solid circles; R branch – open diamonds).
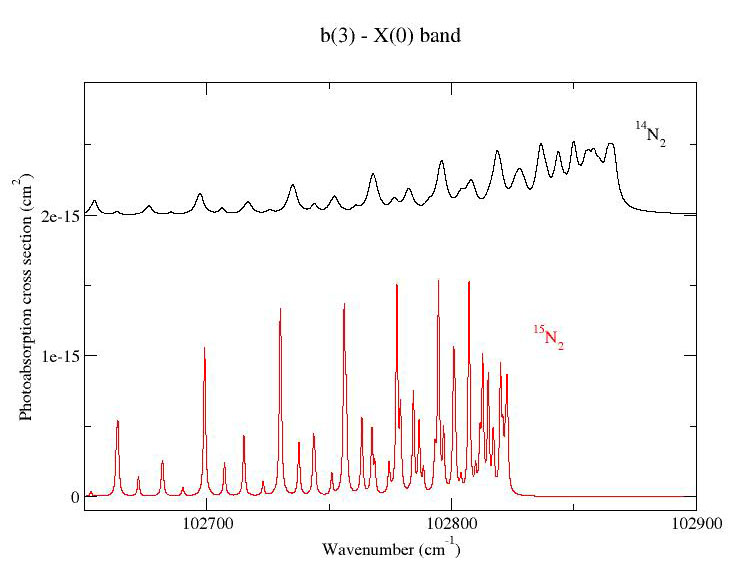
The spectra of the isotopologues of N2 differ not only in associated line positions, but also in line-strength and line-width patterns. As an example, the figure below shows modeled 14N2 and 15N2 cross sections of the b(3) – X(0) band at 300 K. The 14N2 band is strongly broadened (see Haverd et al. (2005)), with Lorentzian line widths near the band head on the order of 3 cm-1, while the 15N2 band-head line widths are about 0.7 cm-1 (Sprengers et al. 2005).
 |
|


