![]()
What it does: Boxplots graphically display measures of dispersion for a given variable--the range, median, and quartiles.
Where to find it: Under the Graphs menu, choose Boxplot. Click on Simple, and click on Summaries for separate variables. Click Define. Move the variable you would like to plot into the "boxes represent" area, then click OK.
SPSS Output
Following is an example of a boxplot for the variable Age.
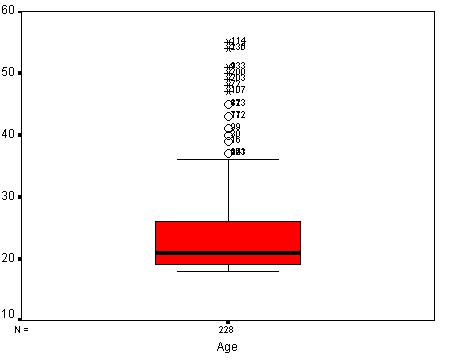
The box represents the interquartile range. The line across the box indicates the median.
The "whiskers" are lines that extend from the box to the highest and lowest values, excluding outliers. The circles above our upper whisker represent the outliers.
The location of the box between the whiskers tells us how the data are distributed. If the box is in the middle of the whiskers, the data are probably more evenly distributed. If the box is closer to the lower whisker, the data are probably skewed towards the lower end of the scale. If the box is closer to the upper whisker, the data are probably skewed towards the higher end of the scale.
In our example, the range of ages excluding outliers is from about 18 years to 38 years. The median age is about 20. It looks like we have mostly younger people in our sample. We can also see that we have several outliers.
Home
| Review Test | Decision
Tree | Procedure
List
Susan Archambault
Psychology Department, Wellesley College
Created By: Nina Schloesser '02
Created On: July 28, 2000
Last Modified: July 30, 2000