![]()
What it is: The Chi Square Goodness of Fit test determines if the observed frequencies are different from what we would expect to find (we expect to see equal numbers in each group within a variable).
Where you find it: Under the Analyze menu, choose Nonparametric Tests, then Chi Square. Move the variable you wish to look at into the "Test Variables" box, then click OK.
Assumptions
-None of the expected values may be
less than 1
-No more than 20% of the expected values
may be less than 5
Hypotheses
Null: There are approximately equal numbers of cases in each group
Alternate: There are not equal numbers of cases in each group
SPSS Output
Following is sample output of a Chi Square Goodness of Fit test. We wanted to see if different socioeconomic groups are equally represented among Wellesley students.
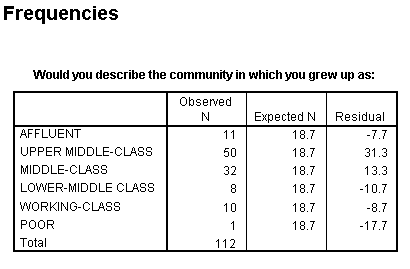
First, we see a frequency table for each group.

The "Observed N" tells us how many people are in each group. For example, we see that there are 32 people who identified themselves as "middle-class."
The "Expected N" tells us how many people we expected to find in each group, if there is no difference between groups. Here we see that we expected to find 18.7 people in each group.
The "Residual" tells us how different each group is compared to what we expected to find. We see that there are 13.3 more people than we expected to find in the "middle-class" group.
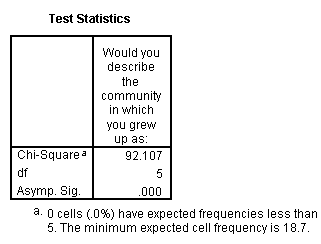
Next, we see the results of the Chi Square test.

We have a Chi Square value of 92.107 (which is very large!).
Our significance level is .000.
There is a significant difference (our significance level is less than .05). Therefore, we can say that there are not equal numbers of Wellesley students from each socioeconomic group. It appears that we have more upper-middle class students than expected, and fewer poor students than expected.
Home
| Review Test | Decision
Tree | Procedure
List
Susan Archambault
Psychology Department, Wellesley College
Created By: Nina Schloesser '02
Created On: July 30, 2000
Last Modified: July 30, 2000