
What it does: The Chi Square Test of Independence tests the association between 2 categorical variables.
Where to find it: Under the Analyze menu, choose Descriptive Statistics, then choose Crosstabs. Move one variable into the box marked "rows" and the other into the box marked "columns." It does not matter which variable you put in either rows or columns. Under the "Statistics" button, be sure to check off Chi Square. Under the "Cells" button, be sure to check off Expected (in order to obtain the expected values for each cell).
Assumptions:
-None of the expected values may be less than 1
-No more than 20% of the expected values may be less than 5
Hypotheses:
Null: There is no association between the two variables.
Alternate: There is an association between the two variables.
SPSS Output
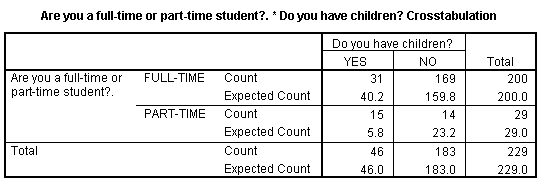
Following is sample output of a Chi Square Test of Independence. We wanted to see if whether or not students have children is related to whether or not they attend school full or part time. That is, are students with children more likely to attend class part-time?
First we see the "Case Processing Summary."

There are a total of 230 people who participated in our study, but there is one missing case. Thus, our valid number of cases (Valid N) is 229.
Next we see the contingency table.

We can see in each cell how many people are in each group. For example, we see that there are 31 students who are full-time with children. There are 14 students who are part-time with no children.
We can look to the marginals, or the ends of each row or column, to find the total number for that category. For example, there are 46 students who have children. There are 200 students who are full-time.
The contingency table also gives the expected values for each cell. For example, we expected to find 40.2 students who are full-time with children.
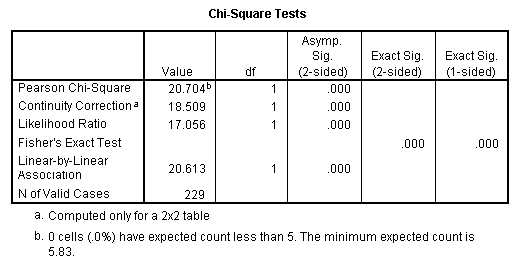
Finally, we see the results of our Chi Square Test of Independence.

We see that our Pearson Chi Square value is 20.704. We have 1 degree of freedom. Our significance is .000.
There is a significant difference (our significance level is less than .05). Therefore, we can say that the two variables are associated. Whether or not you are a full- or part-time student depends on whether or not you have children.
Home
| Review Test | Decision
Tree | Procedure
List
Susan Archambault
Psychology Department, Wellesley College
Created By: Nina Schloesser '02
Created On: July 30, 2000
Last Modified: July 30, 2000