![]()
What it does: The Independent Samples T Test compares the mean scores of two groups on a given variable.
Where to find it: Under the Analyze menu, choose Compare Means, the Independent Samples T Test. Move your dependent variable into the box marked "Test Variable." Move your independent variable into the box marked "Grouping Variable." Click on the box marked "Define Groups" and specify the value labels of the two groups you wish to compare.
Assumptions:
-The dependent variable is normally distributed. You can check for normal distribution
with a Q-Q plot.
-The two groups have approximately equal variance on the dependent variable.
You can check this by looking at the Levene's Test. See below.
-The two groups are independent of one another.
Hypotheses:
Null: The means of the two groups are not significantly different.
Alternate: The means of the two groups are significantly different.
SPSS Output
Following is a sample output of an independent samples T test. We compared the mean blood pressure of patients who received a new drug treatment vs. those who received a placebo (a sugar pill).

First, we see the descriptive statistics for the two groups. We see that the mean for the "New Drug" group is higher than that of the "Placebo" group. That is, people who received the new drug have, on average, higher blood pressure than those who took the placebo.

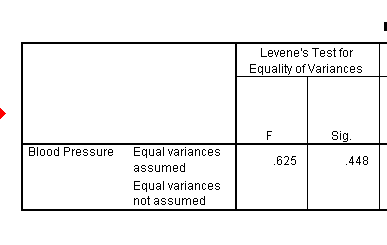
Next, we see the Levene's Test for Equality of Variances. This tells us if we have met our second assumption (the two groups have approximately equal variance on the dependent variable). If the Levene's Test is significant (the value under "Sig." is less than .05), the two variances are significantly different. If it is not significant (Sig. is greater than .05), the two variances are not significantly different; that is, the two variances are approximately equal. If the Levene's test is not significant, we have met our second assumption. Here, we see that the significance is .448, which is greater than .05. We can assume that the variances are approximately equal.
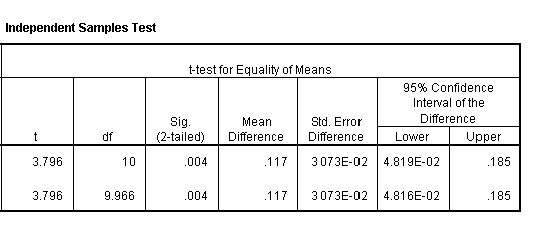
Finally, we see the results of the Independent Samples T Test. Read the TOP line if the variances are approximately equal. Read the BOTTOM line if the variances are not equal. Based on the results of our Levene's test, we know that we have approximately equal variance, so we will read the top line.

Our T value is 3.796.
We have 10 degrees of freedom.
There is a significant difference between the two groups (the significance is less than .05).
Therefore, we can say that there is a significant difference between the New Drug and Placebo groups. People who took the new drug had significantly higher blood pressure than those who took the placebo.
Home
| Review Test | Decision
Tree | Procedure
List
Susan Archambault
Psychology Department, Wellesley College
Created By: Nina Schloesser '02
Created On: July 31, 2000
Last Modified: July 31, 2000