![]()
What it does: Simple Linear Regression tells you the amount of variance accounted for by one variable in predicting another variable
Where to find it: Under the Analyze menu, choose Regression, then choose Linear. Enter the dependent and independent variables in the appropriate places, then click OK.
Assumptions:
-The data are linear (if you look at a Scatterplot of the data, and the data
seem to be moving in a straight line, that's a good indication that the data
are linear).
-The dependent variable is normally distributed. You can check for normal distribution
with a Q-Q plot.
Hypotheses:
The hypotheses for regression focus on the slope of the regression line.
Null: The slope equals zero (there is no slope)
Alternate: The slope is not equal to zero
SPSS Output
There are 3 key pieces of information we need
to look for in our regression output:
-The R Square value
-The significance of the regression
-The values of the constant and slope
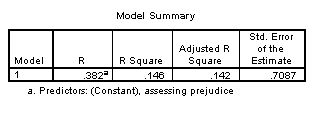
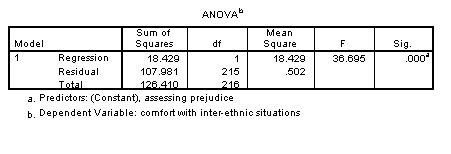
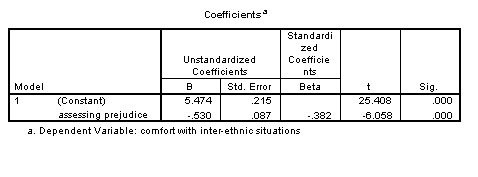
Following is sample output where Assessing Prejudice is the independent variable and Comfort with Inter-Ethnic Situations is the dependent variable.

The R Square tells us how much of the variance of the dependent variable can be explained by the independent variable. In this case, 15% of the variance in Comfort can be explained by differences in levels of prejudice.

The significance in the ANOVA table tells us if this is a significant linear regression. In this example, we do have a significant linear equation (p<.01).

Finally, the Coefficients table gives us all the information we need to plug into our Y' = b0 + b1X equation (where b0 = the constant and b1 = the slope). In this example, b0 = 5.474 and b1 = -.53.
Our equation is: Y' = 5.474 + -.53x
Home
| Review Test | Decision
Tree | Procedure
List
Susan Archambault
Psychology Department, Wellesley College
Created By: Nina Schloesser '02
Created On: July 31, 2000
Last Modified: July 31, 2000