Color – Color in the Brain: The What System
Where and What
Visual information is processed along parallel tracks: different kinds of neurons in the retina are wired up to the photoreceptors in different ways, to extract different kinds of information. Some cells are sensitive to movement, others to cone opponency, and others to spatial contrast. Within each track, information is communicated along a series of hierarchical stages beginning with these retinal neurons, moving via the optic nerve to the thalamus and on to primary visual cortex (V1) and then higher cortical regions (V2 and up) where it is ultimately integrated to produce our experience of motion, color and form. One useful model divides the neocortex of the visual brain into two broad subdivisions, a dorsal stream involving brain areas on the top (dorsal surface) of the brain, and ventral stream involving brain areas on the bottom of the brain. These two streams, referred to as the Where pathway and the What pathway, are concerned with extracting where an object is located in visual space (and where the viewer is located in reference to the external world), and what the object is (what color, shape, texture). The Where system is thought to be more primitive (evolutionarily older) than the What system, and is responsible for the perception of motion, space, position, three-dimensionality, figure/ground segregation, and the overall organization of the scene. This system is colorblind, has high contrast sensitivity, operates quickly, and has a slightly lower acuity than the “What” system. The “What” system provides us with the ability to identify objects, faces and color.
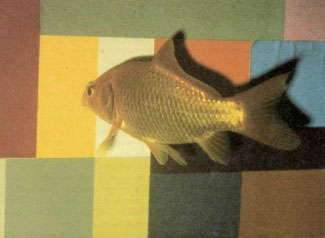 In David Ingle's experiment, a goldfish has
been trained to swim to a
In David Ingle's experiment, a goldfish has
been trained to swim to a
patch of a given
color for a reward—a piece of liver. It
swims to the green
patch regardless of the
exact setting of the three projectors' inten-
sities.
The behavior is strikingly similar to
the perceptual result in humans.
From Hubel, Eye Brain and Vision, Scientific American Press 1995.
 Set up for a Land Color Constancy Demonstration.
Two identical “Mondrian” displays are illuminated with different relative mixtures of red, green and blue light, yet the color appearance of each of the regions of the Mondrian remains the same. Color Constancy and Edwin H. Land
Color constancy is the visual phenomenon that the perceived color of an object remains relatively constant under varying illuminants (so long as the illuminant covers a broad range of wavelengths). Color constancy is achieved because the brain computes color by determining local cone response ratios. When comparing the responses of a number of cones over a local area, the brain is comparing the ranges of wavelengths reflected by different objects in the visual scene. This allows the brain to estimate the illuminant and discount it. Color constancy explains why the grass in your front yard appears green under blue sky and remains green under cloudy sky, when the light source contains less short wavelengths.
Edwin Land, founder of Polaroid and inventor of instant color photography, developed fabulous demonstrations of color constancy, which led to his Retinex Theory, a computational account of how color constancy could be achieved. The essential component of Land’s theory was a local comparison of relative cone activities. Nigel Daw discovered neurons in the goldfish retina that were capable of such a local color-contrast calculation. Perhaps because of Daw’s discovery, Land initially thought his theory was implemented in the retina, but when intensive searches for color-contrast neurons in the retinas of trichromatic primates came up dry, Land thought the implementation could be in the cortex… hence the name Retinex. To demonstrate the dramatic extent of color constancy, Land used three adjustable red, green, and blue filtered lights to illuminate a Mondrian style patchwork of colored squares and rectangles .
First he adjusted the intensities of the three lights so that a particular patch appeared white. At this time he noted the color of a neighboring patch—let’s say it was blue. Then he used a photometer to measure the intensity of the red, green, and blue light reflected from the white patch. Next, he readjusted the intensity of the lights such that the neighboring blue patch would reflect the same intensities of red, green, and blue light that the white patch originally had, ensuring that the energy reaching the eye would be the same as it had been for the white patch. Rather than seeing the blue patch turn white, what Land observed was a conservation of color: the white patch still appeared white and the neighboring patch still blue. If the same energy was reaching the retina, but was not generating the same perception, the brain must have been doing something secondary to the information received by the retina to generate color perception.
Land’s colleagues John McCann and Jeanne Benton visited the class in the spring of 2008 and presented this landmark demonstration—along with others from Land’s laboratory—and the demonstration has since been replicated by former Vision and Art student Liz Hirshman for a course lab.
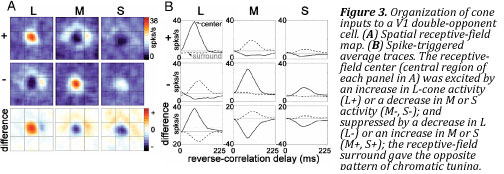
Double-opponent cells
In the previous section we learned about color-opponency, which describes the way in which the activation of the three cone types over a small region of the visual field gets compared by ganglion cells in an antagonistic fashion along two tracks, red-green and yellow-blue. The LGN routes this information to regions in primary visual cortex, called blobs, where cells with larger receptive fields—that is, cells that respond to larger regions of the visual field—make the color-opponent and spatial-opponent analyses responsible for color constancy. These double-opponent cells compute the local ratios of cone responses, allowing the visual system to extrapolate the composition of the illuminant and discount it.
Luminance, Equiluminance and Monet (and advertisers)
Luminance is a measure of the amount of light emitted from a surface that falls within a defined area. It is measured in candelas per square meter; and is what artists call “value”. Quantifying luminance for a given surface indicates the amount of luminous power the eye will detect when looking upon that surface from a given angle. The envelope that encompasses photoreceptor sensitivity is called the Vλ (V lambda) function; luminance is calculated by taking the dot product of the spectral distribution of the light reflected or emitted from a surface and the Vλ function. Because the Vλ function is considered a constant from person to person, luminance is therefore an accurate measure of the physical stimulus. From luminance, the brain computes brightness, which is a subjective experience. Two objects may have exactly the same luminance but appear different brightness, as shown in the demonstrations below.
|
|
Brightness illusion by Ted Adelson. “A” and “B” have the same luminance, but not the same brightness. |
Brightness illusion by Bart Anderson. The chess pieces in both top and bottom are physically identical, yet have different brightness. |
Surfaces that have the same luminance but differ in color are said to be equiluminant. Equiluminance is difficult to demonstrate on a computer monitor: the monitor needs to be carefully calibrated; if it is not, than there will be residual luminance contrast and our Where system is very sensitive to luminance contrast. Stimuli at equiluminance are blind to the Where system, and have a bizarre “jumpy” visual quality that some have said is reminiscent of the way dyslexics see the world. For example:

These surfaces can only be discriminated by the visual channel concerned with color: the What system. Because the Where system is colorblind, equiluminant displays are invisible to it. Margaret Livingstone has many wonderful examples of equiluminance effects in impressionism, in her book Vision and Art: the biology of seeing (Abrams, 2002; paperback, 2008). For example, Monet makes use of this trick in his famous work, Impression Sunrise, in which he depicts the sun as the same luminance as the background sky (an impossibility in the real world!).
Notice how the vibrant sun disappears when the painting is de-saturated. Again, the Where system is unable to detect this object since its luminance matches that of the pale blue sky behind it, a funny paradox.
 Color Deficiencies
A number of color deficiencies exist for which people do not see the Red, Orange, Yellow, Green, Blue, Violet spectrum characteristic of trichromatic vision:
Dichromacy occurs when one of the cone pigments is missing, reducing color vision to just two dimensions. The condition is inherited and is sex-linked. Jay and Maureen Neitz have done extensive research on the genetics of color blindness. Because any one of the three cone pigments can be missing, three forms of dichromacy exist:
Protanopia,
where the “red” long-wavelength cones are missing: |
Deuteranopia,
where the “green” middle-wavelength cones are missing: |
Tritanopia,
where the “blue” short-wavelength cones are missing: |
|
|
|
Monochromacy is the inability to distinguish color altogether, resulting from the absence of two or more cone types. Rod monochromacy or achromatopsia is the condition in which an individual possesses no cones and relies instead on rods alone. Not only does a person lose the ability to distinguish colors, the individual loses the ability to see under normal lighting conditions. Cone monochromacy is the condition in which an individual possesses rods and only a single type of cone. Such individuals will have good form and pattern vision, but cannot discern hues. One such individual, Amanda Goltz, visited the Vision and Art class in the Spring of 2008 to discuss life without color.
Anomalous Trichromacy is a condition that occurs when one of the cone pigments is mutated, shifting its spectral sensitivity.
Cerebral achromatopsia is a color deficiency that results from damage to the parts of the cerebral cortex that are responsible for color perception due to injury or illness. Patients lose the ability to discern colors, but maintain the ability to perceive chromatic borders. One famous case study of this condition, by Oliver Sacks, is that of “Jonathan I,” a painter who sustained an injury to his occipital lobe, leaving him colorblind. In the same way that patients can sustain damage to the color-coding parts of the brain, patients can loose function of the motion-coding parts of the brain or the object-coding parts of the brain. The most important motion center is called area MT, while the most important object area is the fusiform face area (FFA), responsible for recognizing and discriminating faces. Strokes of area MT leave patients unable to discriminate motion, yet able to see form and color. These patients describe their worlds as a series of strobe-light images, and are unable to do simple things like cross the road, pour liquids or drive. Strokes of the FFA leave patients unable to see faces. As you can see, stroke studies are useful in identifying which brain regions are necessary for a given function. But strokes are rarely neat and tidy, rarely constrained to a single brain area. Today non-invasive imaging techniques, like functional Magnetic Resonance Imaging (fMRI) and positron emission tomography (PET), are widely used, and are revolutionizing the study of the functional organization of the brain.